Product Carbon Footprint (PCF): Calculation, ISO 14067 & CBAM
A product carbon footprint (PCF) is the greenhouse gas emissions attributable to one unit of a product across its entire life cycle. Measured in kilograms of CO2 equivalent (kgCO2e), it covers raw material extraction, production, transport, and packaging, but not the broader company-wide emissions footprint.
The Comparable Metric
PCF creates a single, comparable number that buyers use to differentiate between suppliers. One tonne of steel from Supplier A carries 2,100 kgCO2e from cradle to gate. The same grade from Supplier B carries 1,700. Procurement teams now treat that 400-unit gap as seriously as they treat price variance.
PCF and corporate carbon footprint serve different purposes
Both draw from the same underlying data; neither of them replaces the other. A corporate carbon footprint answers: "What were our total emissions this year?" A product carbon footprint answers: "What emissions does this specific unit carry?"
Corporate Footprint | Product Carbon Footprint | |
Scope | Total company emissions per year | Emissions per product unit |
Structure | Scope 1, 2, 3 by source | Lifecycle stages from extraction to disposal |
Primary Audience | Regulators, investors, boards | Customers, procurement teams, customs authorities |
Governing Standards | GHG Protocol Corporate Standard | ISO 14067:2018, GHG Protocol Product Standard |
Your PCF becomes the input to your customer's Scope 3 inventory while your corporate GHG data becomes the foundation for your PCF calculations. To understand both, see our guide to Scope 1, 2, and 3 emissions.
System Boundaries: Cradle to Gate vs. Cradle to Grave
Cradle-to-Gate is the B2B standard
This boundary runs from raw material extraction through production, packaging, and shipment, stopping at your factory gate. Your customer owns what happens next: distribution, use, end-of-life management. They model those stages themselves based on their own supply chain and customer base. Cradle-to-gate is also the boundary the EU uses for CBAM embedded-emissions calculations, which is why exporters prioritise it.
Cradle-to-Grave captures the full product story
It extends the boundary to include customer use and end-of-life disposal when that phase dominates the product's environmental impact. Vehicles, refrigerators, and industrial equipment typically require cradle-to-grave analysis. Consumer-facing carbon claims also use this boundary to show a product's complete lifecycle story.
The boundary choice significantly changes the calculated number. Therefore, it is imperative to be stated explicitly in every report.
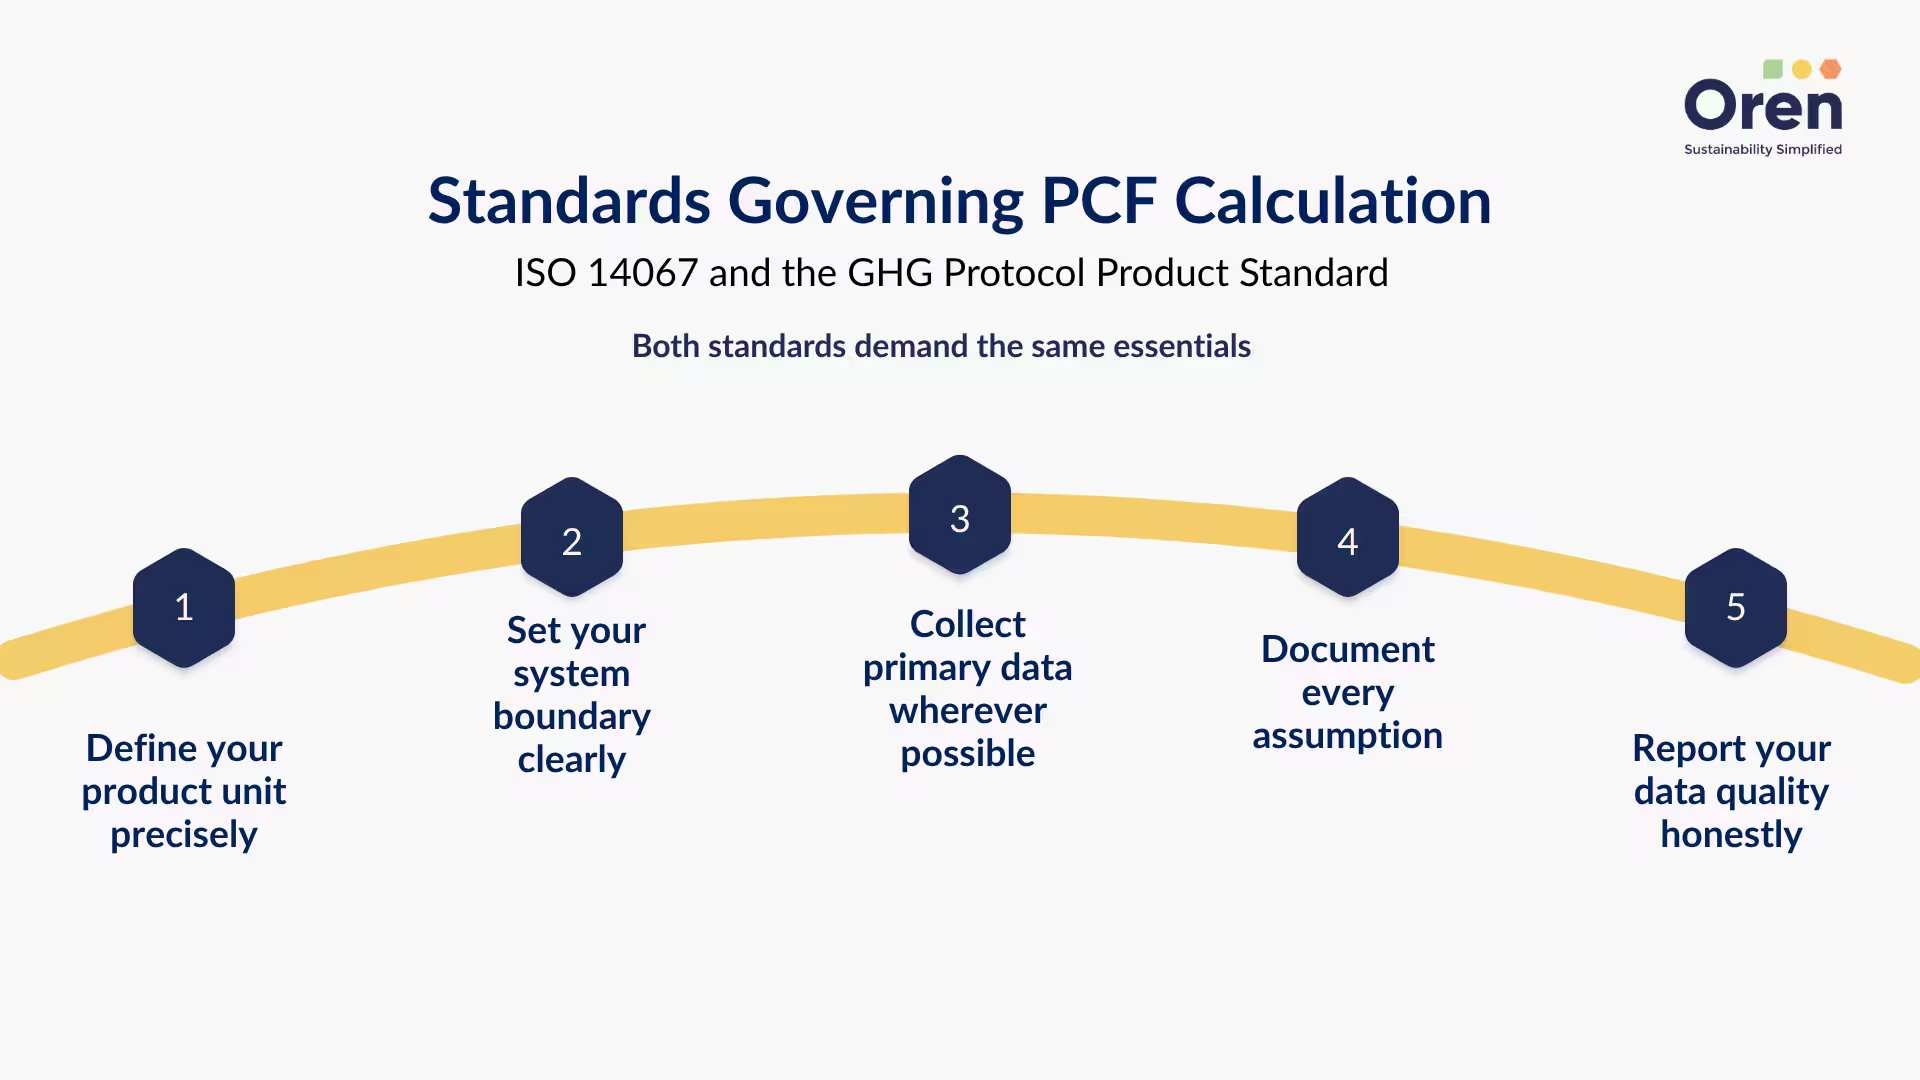
Standards Governing PCF Calculation: ISO 14067 and the GHG Protocol Product Standard
ISO 14067:2018 provides the international framework
ISO 14067 establishes the global standard for quantifying product carbon footprints. It builds on lifecycle assessment principles from ISO 14040 and 14044. The standard specifies how to define functional units, set system boundaries, collect and assess data quality, and report results in a manner that ensures consistency and comparability across organisations and sectors. Its scope is climate impact only; water use, toxicity, and other environmental impacts fall outside the standard.
The GHG Protocol Product Standard provides implementation guidance
The GHG Protocol approach parallels ISO 14067 with more detailed methodological guidance for practitioners. It mandates primary data collection for processes under your direct control. It provides clear allocation methods for situations where a single facility produces multiple products. It requires transparent reporting of data quality across each lifecycle stage.
Both standards demand the same essentials
Define your product unit precisely.
Set your system boundary clearly.
Collect primary data wherever possible.
Document every assumption.
Report your data quality honestly.
A PCF calculated properly under one standard will withstand scrutiny under the other.
Data portability through PACT
The WBCSD Partnership for Carbon Transparency (PACT) maintains a standardised methodology and data-exchange format for PCF information. This allows a PCF calculated in one country to be transmitted to buyers in another without requiring translation or recalculation, reducing friction in global supply chains.
How to Calculate a Product Carbon Footprint: The Six-Step Process
PCF calculation follows the same logical sequence regardless of which standard you apply. These six steps move from zero data to a defensible, auditable result.
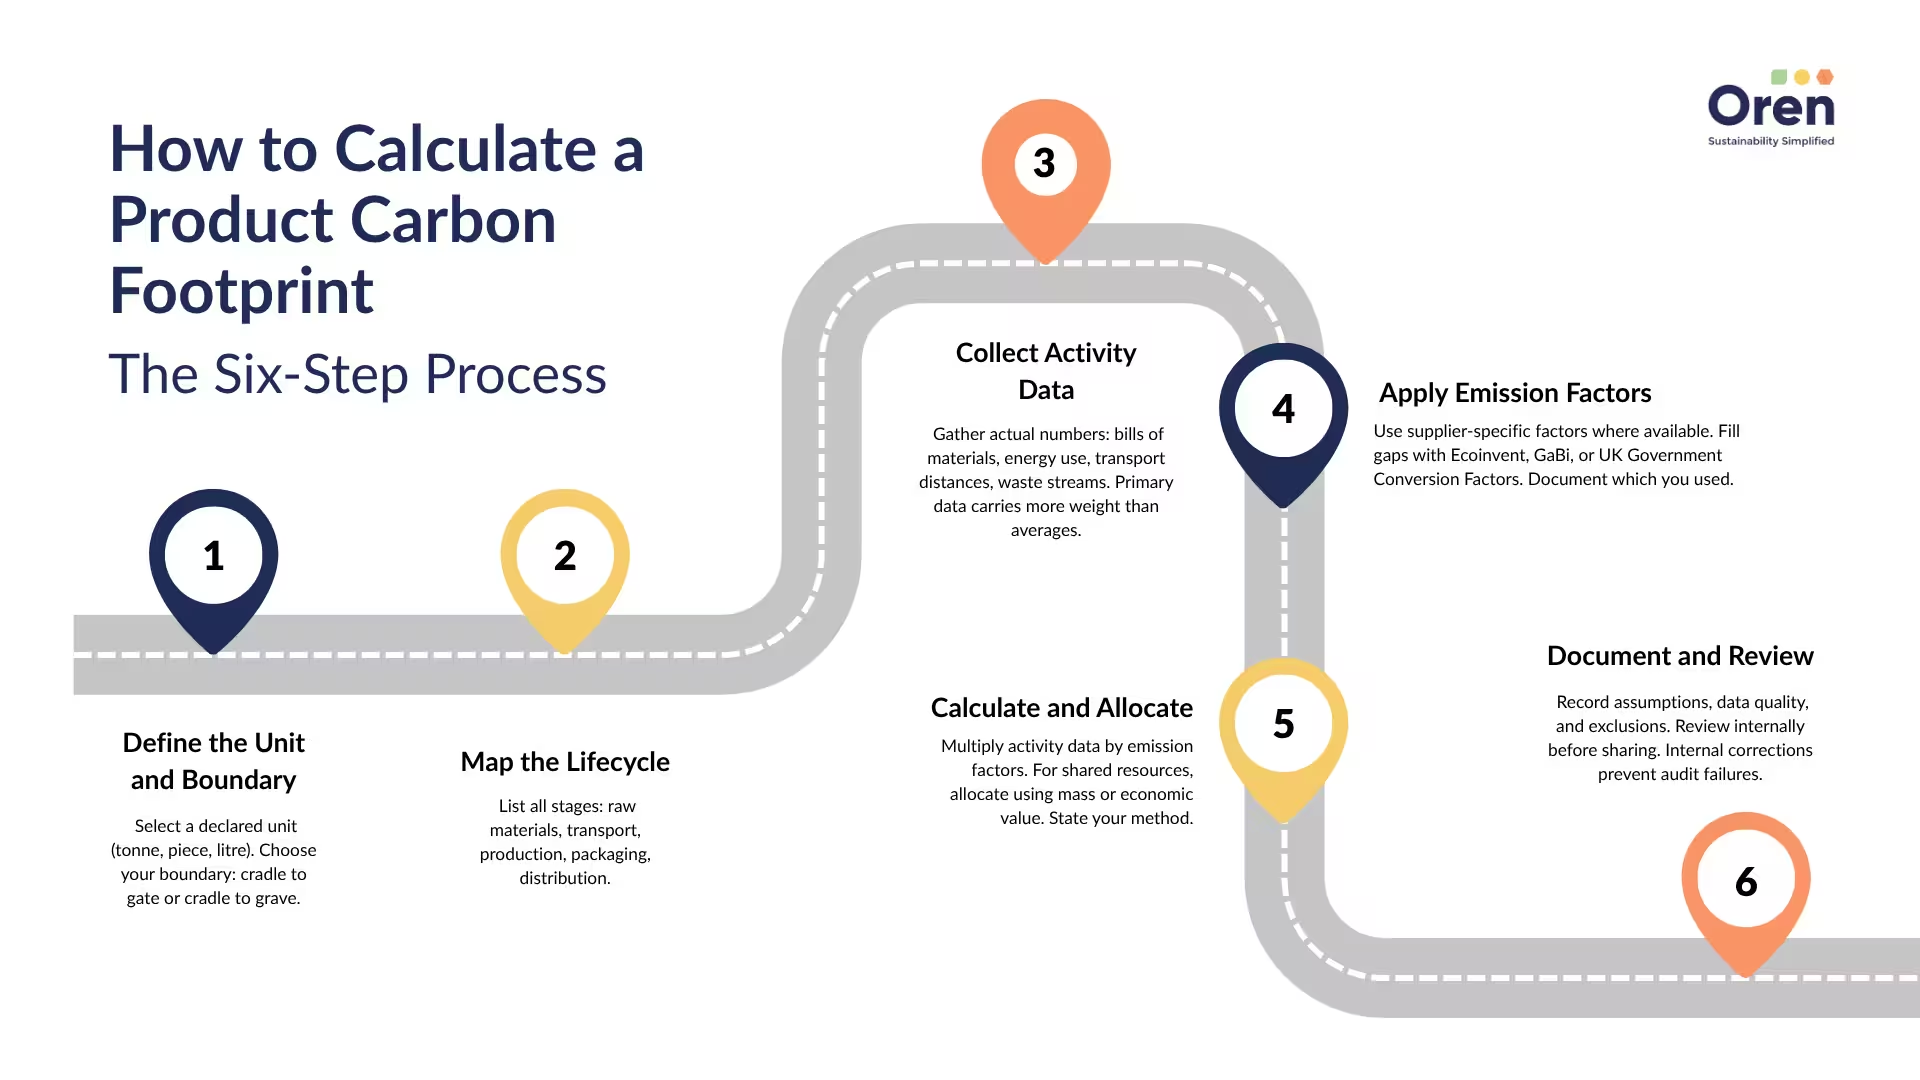
Step 1: Define Your Product Unit and System Boundary
Select a clear declared unit: one tonne, one piece, one litre. Specify your system boundary, whether it is cradle-to-gate or cradle-to-grave. For B2B products, cradle-to-gate is standard practice.
Step 2: Map Your Complete Lifecycle
Document every stage within your boundary: raw material extraction and processing, inbound logistics, primary production, secondary processing if applicable, packaging, and outbound distribution. Omitted stages become audit failures later.
Step 3: Collect Activity Data
Gather actual operational numbers: bills of materials, energy consumption by process and time period, transport distances and modes, waste streams and their disposal methods. This step consumes most effort. Primary data recorded from your own operations always carries more evidentiary weight than assumed averages. Meter readings, utility invoices, and production logs are the typical sources for this data.
Step 4: Apply Appropriate Emission Factors
Use supplier-specific emission factors when available. For gaps, use recognised databases such as Ecoinvent, GaBi, or UK Government Conversion Factors. Clearly document which factors you used and where. Auditors will verify this distinction.
Step 5: Calculate Totals and Allocate Shared Emissions
Multiply activity data by corresponding emission factors. For shared resources (a furnace serving three product lines, steam from a central boiler), allocate emissions using a stated, consistent method: mass allocation, economic value allocation, or another defensible basis. State your allocation rule very clearly.
Step 6: Document Assumptions and Conduct Internal Review
Write down all assumptions, data quality assessments, and anything you deliberately excluded. Review the calculation internally before sharing it externally. Internal corrections are efficient. External challenges are costly.
Why evidence matters more than mathematics
Arithmetic errors are rare in PCF calculations. Credibility failures are the most common pitfalls. A PCF stands or falls based on whether steps 3, 4, and 6 leave a clear, traceable record. If they do, the number survives external review. If they don't, it doesn't.
Why the Commercial Deadline Is Now: Three Converging Forces
Force 1: CBAM prices embedded emissions
The EU's Carbon Border Adjustment Mechanism imposes a carbon price on imports of steel, aluminium, cement, fertilisers, hydrogen, and electricity. From January 1, 2026, EU importers must surrender CBAM certificates corresponding to the embedded emissions in covered goods. Default emission values used when suppliers cannot provide actual data are set conservatively high and increase annually. Suppliers that provide verified product-level data can help their customers avoid these inflated defaults, creating immediate competitive advantage.
Force 2: Large buyers have matured their Scope 3 programmes
A few years ago, large manufacturers accepted industry-average emission factors for Scope 3 calculations. Today, they request supplier-specific product data because they need to demonstrate actual improvement, not hide behind category benchmarks. Any buyer reporting under CSRD supply-chain requirements or responding to CDP questionnaires is already requesting product-level PCF data from their supply base.
Force 3: Rating schemes now require product-level measurement
EcoVadis assessments now expect suppliers to provide product carbon data rather than company-level estimates. CSRD value-chain disclosures require actual supplier emissions, not proxies. CDP questionnaires request specific product information from key suppliers. Better assessment scores translate to better commercial terms: preferred supplier lists, contract renewals, and volume commitments.
The pattern is consistent across all three forces. Your customer faces a legal or rating obligation; that obligation flows downstream to you. The deadline is fundamentally commercial, which means suppliers who can answer these requests first win the contracts.
Scaling PCF Calculation: When Software Becomes Essential
Spreadsheets fail at scale
One PCF calculation fits comfortably in Excel, but a portfolio of fifty products across three manufacturing facilities does not. Activity data scatters across ERP systems, utility provider portals, and supplier invoices. Emission factors get applied inconsistently across these products. Therefore, when a customer challenges a number, you cannot quickly trace it back to its source; without audit trails, credibility collapses.
Software solves the scaling and governance problem
Dedicated product carbon footprint software consolidates your corporate GHG inventory and product models into a single data layer. When a production facility changes energy sources, that change automatically flows through to every product produced there. Sources attach to each figure. Audit trails remain complete, traceable, and data quality assessments stay current.
How integrated platforms work in practice
Oren Sustainability Hub connects your GHG accounting system and product-level PCF calculations. The same validated emissions data that powers your corporate Scope 1, 2, and 3 reporting feeds directly into your PCF calculations. Sources remain attached, and teams using this approach produce credible, auditable PCFs for 50+ products in weeks rather than months. Learn more about Oren's GHG accounting and schedule a demo with our team as you prepare to map your product range.
Key Takeaways
A product carbon footprint measures the greenhouse gas emissions of one product unit across a specified lifecycle boundary, with cradle-to-gate as the standard for business-to-business transactions.
ISO 14067:2018 and the GHG Protocol Product Standard establish the rules for credible calculation. Both require primary data collection, transparent documentation of assumptions, and honest reporting of data quality.
The commercial deadline is now. CBAM certificates begin in January 2026. Buyer Scope 3 requests are active. Ratings schemes reward product-level measurement today. Suppliers who can answer these requirements are securing contracts.
Begin with your corporate GHG inventory. Organisations with clean Scope 1, 2, and 3 data can produce their first credible PCF in weeks. Schedule a demo to map your product range and build your measurement roadmap.
Frequently Asked Questions (FAQs)
Q1. What is the difference between a product carbon footprint and a life cycle assessment?
A life cycle assessment quantifies multiple environmental impacts: water consumption, toxicity potential, acid rain potential, climate impact, and others. A product carbon footprint measures only greenhouse gas emissions the climate impact slice of a full LCA. Both use the same underlying methodology. A PCF is narrower in scope. Every PCF relies on LCA thinking; not every LCA stops at carbon alone.
Q2. Is ISO 14067 certification required?
Certification is not legally mandatory. Practical market requirements are. EU importers now need embedded-emissions data for CBAM compliance. Your largest customers request PCFs to close their own Scope 3 reporting obligations. EcoVadis assessments reward suppliers with product-level carbon data. Suppliers who can provide this information are securing better commercial terms than those who cannot.
Q3. What activity data should I collect?
Gather operational data for each lifecycle stage: bills of materials, production energy consumption (electricity, natural gas, steam), inbound and outbound transport (distance, mode, weight), packaging specifications, and waste streams by disposal method. Primary data measurements from your own operations always carry more weight in audits than secondary database values. When primary data is unavailable, use recognised databases: Ecoinvent, GaBi/Sphera, UK Government GHG Conversion Factors. Always document which data sources you used.
Q4. How long does it take to produce a first product carbon footprint?
With organised bills of materials and clean corporate GHG data, integrated software can produce a credible PCF for a single product in 2-4 weeks. Manual spreadsheet-based approaches typically require 2-3 months per product. The bulk of time goes to Step 3, collecting and organising activity data from across your operations. The actual calculation is fast. Subsequent products move faster once your data collection processes are established.
Q5. Is a product carbon footprint legally mandatory?
No universal law requires every product to have a certified PCF. Practical requirements are rising rapidly. EU importers must declare embedded emissions for CBAM-covered goods. Large manufacturers request PCFs from suppliers to meet their CSRD value-chain obligations. Sustainability ratings platforms expect product-level data as standard. Suppliers who have this capability are competing more effectively than those without it.

About the author
Olivia Paul
ESG & Sustainability Advisor
Olivia is an ESG & Sustainability Advisor at Oren, focused on ESG reporting and strategy, materiality assessments, GHG inventory, and net-zero roadmaps across manufacturing, financial services, and infrastructure.